Jul 8, 2026
Amazon Beauty Reporting: Agency Metrics Win in 2026
Amazon beauty brand reporting agency metrics ranked for 2026: TACoS, sell-through, and Buy Box tracking compared against typical in-house dashboards.
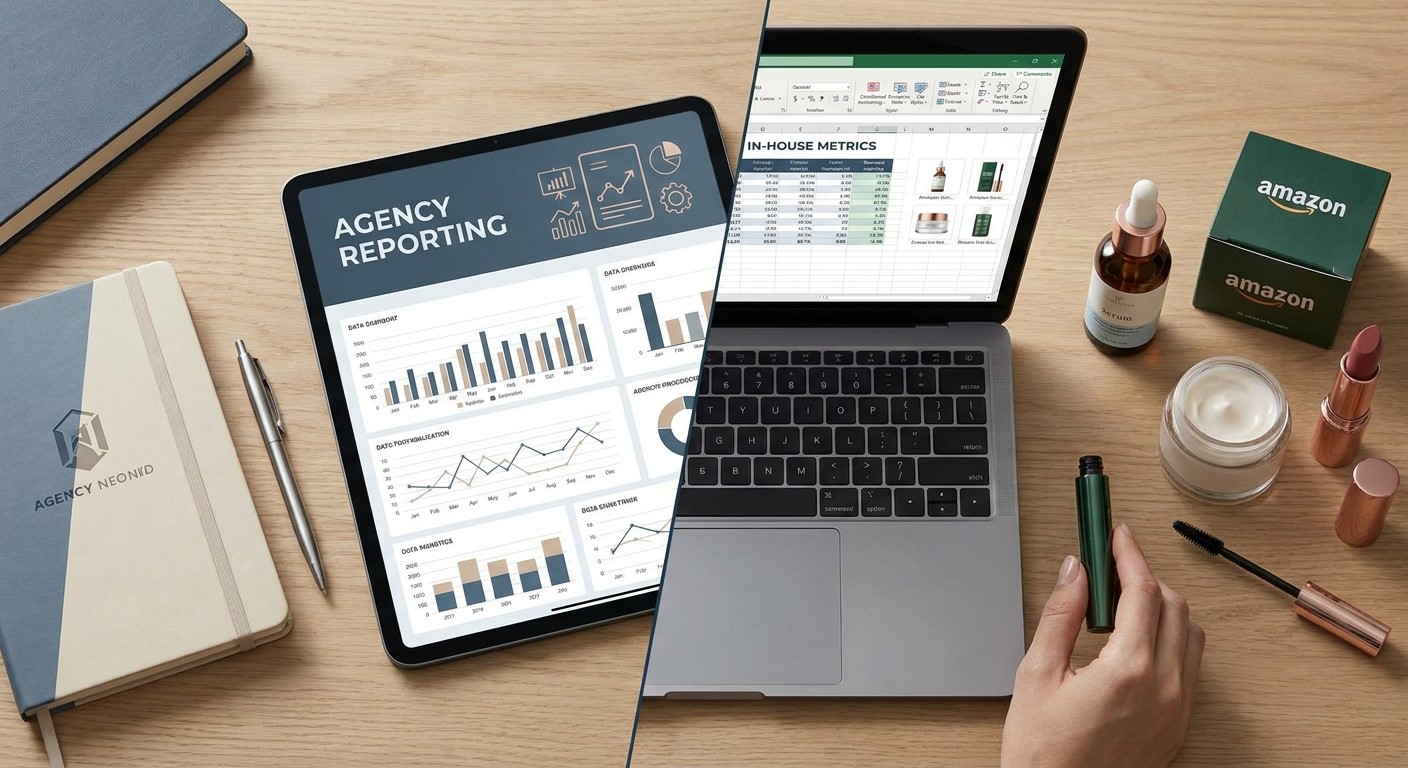
Most Amazon beauty brands find out their reporting was broken the week a hero SKU went out of stock with zero warning. This guide ranks the metrics that actually predict revenue against the vanity numbers that fill most monthly decks, and tells you which reporting model - agency or in-house - catches the problems before they cost you a Q4.
TL;DR
Amazon beauty brand reporting agency metrics in 2026 center on TACoS trend, sell-through rate, and organic-versus-sponsored revenue split - not impressions or ad spend alone. Booscala's in-house model tracks these weekly across US and EU catalogs; most brands running reporting internally check them monthly, if at all. Verdict: agency-grade reporting wins on cadence and depth, in-house wins on context - the right answer is usually both, structured correctly. A brand catalog with 40+ ASINs needs weekly TACoS and Buy Box monitoring, full stop.
Why this matters
A beauty brand doing $2M a year on Amazon generates a report every week whether anyone reads it or not - ACoS numbers, sales dashboards, inventory alerts. The problem isn't volume of data. It's that most of it measures the wrong thing at the wrong interval.
In-house teams tend to over-index on ACoS because it's the number the ads dashboard surfaces first. Agencies that know beauty know ACoS in isolation tells you nothing about whether a $1.4M brand is actually growing or just spending more to stand still. The metrics that predict trouble - sell-through rate, review velocity, organic rank movement - rarely show up on a standard beauty brand reporting KPIs sheet unless someone builds it that way on purpose.
2026 raised the stakes here. Amazon's algorithm now weights organic-to-sponsored ratio more heavily in category ranking than it did in 2023, and brands that can't see that split in their own reporting are flying blind on the one lever that compounds.
How this list was built
The ranking below reflects which metrics correlate most directly with revenue outcomes for premium beauty and cosmetics brands selling on Amazon in the US and EU as of 2026 - not which ones are easiest to pull from Seller Central. Metrics are ordered by predictive value: how early each one signals a problem or an opportunity, and how often agency-run accounts versus in-house teams actually track them. Cadence recommendations reflect standard practice for beauty catalogs with 20+ ASINs and monthly ad spend above $15K.
The metrics, ranked
1. TACoS trend - the only ratio that matters at scale
Total Advertising Cost of Sales measures ad spend against total revenue, not just ad-attributed revenue - the number ACoS conveniently ignores. A brand with a 38% ACoS but a TACoS trending down from 22% to 16% over 90 days in 2026 is building organic momentum, not burning cash. Track this weekly, not monthly - a 90-day lag on TACoS means you catch a launch failing three months after the budget's already spent. Verdict: Buy.
2. Sell-through rate - the stockout you can see coming
Sell-through rate (units sold divided by units received, over a set window) predicts stockouts 30-45 days before FBA's own alerts do. Beauty brands with seasonal SKUs - holiday gift sets, SPF lines - live or die on this number every Q4. A brand tracking sell-through weekly can reorder before a hero SKU goes dark; one checking it monthly finds out from a lost Buy Box. Verdict: Buy.
3. Session-to-unit conversion by ASIN - the listing health score
This is the single number that tells you if a listing is actually converting or just getting traffic. A skincare ASIN pulling 8,000 sessions a month at a 4% conversion rate is underperforming next to a comparable listing at 11% - and the gap is almost always A+ content, main image, or price, not traffic volume. Auditing your Amazon beauty brand performance starts here, not with ad spend. Verdict: Buy.
4. Buy Box percentage - the metric agencies hide when it's bad
Buy Box percentage below 90% on a hero SKU is a revenue leak most in-house dashboards don't flag prominently, because it looks fine until it's a crisis. A drop from 98% to 82% over two weeks in 2026 usually means unauthorized sellers, a pricing violation, or an inventory gap - and it costs real units immediately, not eventually. Verdict: Hold - track monthly unless a drop triggers a weekly check.
5. Review velocity - the trust signal the algorithm rewards
A prestige skincare brand generating 15 new reviews a month converts noticeably better than one stuck at 3, independent of ad spend. Amazon's ranking algorithm treats review velocity as a freshness signal in 2026 the same way it treats sales velocity - stale review counts read as a stale listing. Verdict: Hold - monthly tracking, tied to launch cycles.
6. Organic vs sponsored revenue split - rent vs own
This ratio tells you whether a brand is renting its rank through ads or owning it organically. A brand at 70% sponsored revenue is one ad account pause away from a collapse; one at 55% organic has actual defensible equity in the category. This split is the clearest sign of whether spend is building an asset or just buying weekly sales. Verdict: Buy.
7. TACoS by launch stage - context or noise
A new SKU at 45% TACoS in month one looks alarming next to a mature product at 12% - until you segment by launch stage. Comparing these two numbers without that context is how in-house teams panic-cut budgets on products that are actually on track. Verdict: Hold - segment quarterly by product age.
8. EU/US segmented P&L - the report most teams never build
Brands expanding into EU markets in 2026 often keep a single blended P&L that masks which region is actually profitable. A brand doing well in the US at 18% net margin can be losing money in Germany at the same time, and a blended number hides it completely. Verdict: Wait - build this once EU revenue crosses roughly 20% of total, not before.
Agency reporting vs in-house metrics: the comparison
Cadence
Typical in-house reporting: Monthly, ad-hoc
Agency-grade reporting (2026 standard): Weekly, fixed schedule
Core metric
Typical in-house reporting: ACoS
Agency-grade reporting (2026 standard): TACoS + organic/sponsored split
Inventory signal
Typical in-house reporting: FBA stockout alert
Agency-grade reporting (2026 standard): Sell-through rate, 30-day forecast
Regional view
Typical in-house reporting: Blended global P&L
Agency-grade reporting (2026 standard): Segmented US/EU P&L
Listing health
Typical in-house reporting: Traffic and sales only
Agency-grade reporting (2026 standard): Session-to-unit conversion by ASIN
Review tracking
Typical in-house reporting: Total review count
Agency-grade reporting (2026 standard): Review velocity (30-day)
How to source the right reporting model
Match cadence to catalog size. A 5-SKU brand can survive on monthly reporting; a 40-SKU catalog with seasonal peaks needs weekly TACoS and sell-through checks or stockouts happen silently.
Demand segmentation before scale, not after. Any brand planning US-to-EU expansion in 2026 should have region-split P&L reporting built before the first EU shipment lands, not six months into it.
Ask what gets flagged automatically versus what gets buried. A reporting model built by Booscala surfaces Buy Box drops and review velocity dips the week they happen - a spreadsheet updated monthly surfaces them the month after.
FAQ
What's the best metric for tracking Amazon beauty brand performance in 2026? TACoS trend and sell-through rate together give the clearest early-warning signal - TACoS shows whether growth is organic or rented, sell-through shows whether inventory will hold.
Is agency reporting better than in-house metrics tracking? Agency reporting generally wins on cadence and depth because it's the agency's full-time job; in-house wins on product and customer context. The strongest setups combine both.
How often should a beauty brand check Amazon reporting? Weekly for TACoS, Buy Box percentage, and sell-through rate; monthly for review velocity and launch-stage TACoS; quarterly for EU/US segmented P&L.
What does TACoS measure that ACoS doesn't? TACoS measures ad spend against total revenue, including organic sales, so it shows whether a brand is building lasting rank or just buying temporary sales through ads.
How much does poor reporting cost a beauty brand on Amazon? A hero SKU stockout caught 30 days late through a monthly-only reporting cadence typically means several weeks of lost Buy Box share and organic rank that takes months to rebuild.
Do EU-expanding beauty brands need separate reporting from US operations? Yes, once EU revenue reaches a meaningful share of total sales - a blended P&L can mask a losing region behind a profitable one.
What's the biggest reporting mistake beauty brands make on Amazon? Treating ACoS as the primary health metric instead of TACoS, which hides whether ad spend is actually building organic momentum or just covering for a weak listing.
Can in-house teams build agency-level reporting themselves? Some can, but it requires weekly discipline across ASIN-level conversion, sell-through, and TACoS segmentation - most in-house teams have the tools but not the bandwidth to check all of it every week.
One last thing
The single number most 2026 reporting decks skip entirely is organic-versus-sponsored revenue split by ASIN, not by brand total - and it's the one that shows exactly which SKUs are still dependent on ad spend to move at all. Check that before the next budget meeting, not after.
