Sep 3, 2026
Amazon Beauty Brand Reporting KPIs That Matter (2026)
The Amazon beauty brand reporting KPIs that matter in 2026: revenue, TACoS, contribution margin, and catalog health — what to track and how often.
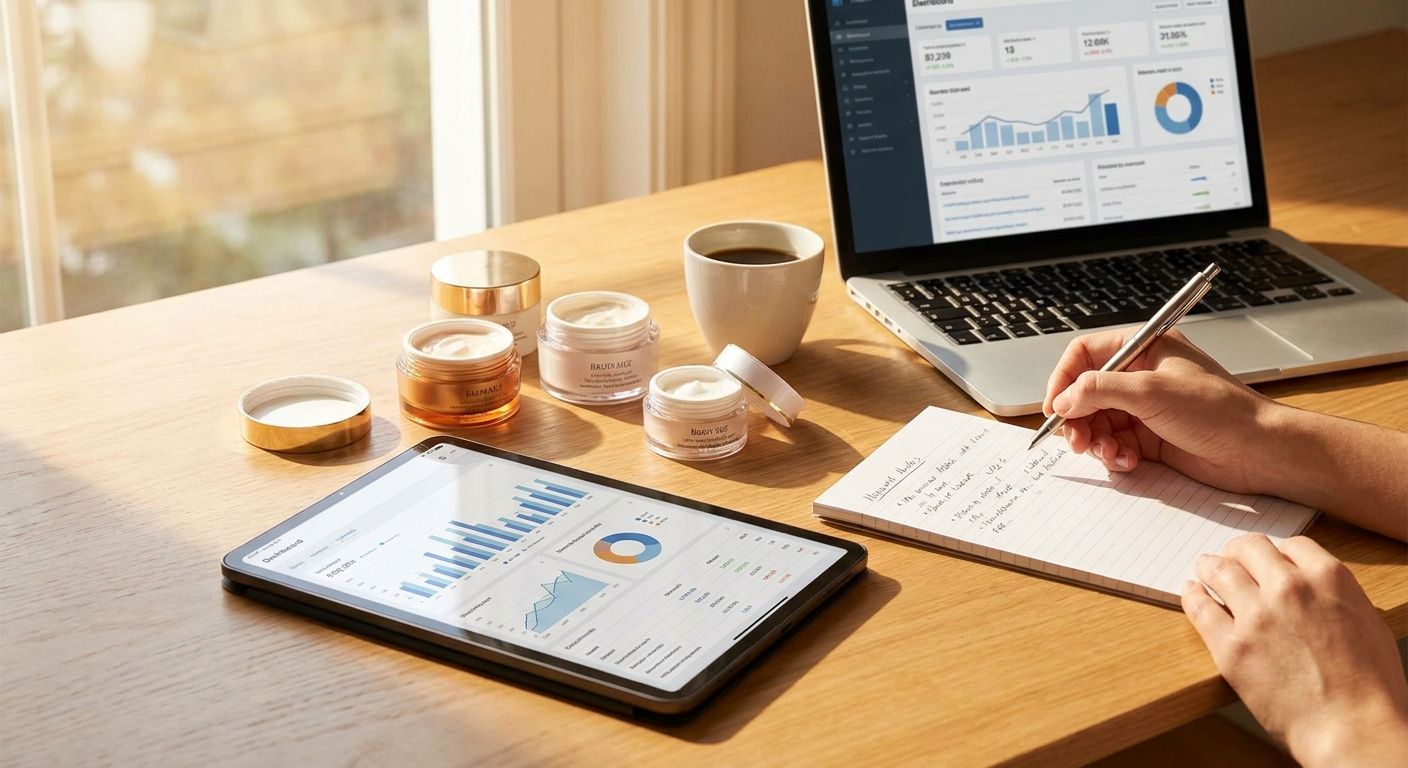
A working Amazon beauty brand reporting KPI stack has four layers: revenue and growth, profitability, advertising efficiency, and catalog health. Skip any one of them and you'll chase a number that looks good in isolation while margin quietly erodes underneath it.
Brands that report Total Sales and Conversion Rate but never check TACoS or Inventory Performance Index end up profitable on paper and cash-strapped in reality — the report says growth, the bank account says otherwise.
TL;DR
Amazon beauty brand reporting KPIs split into four layers: revenue, profitability, ad efficiency, catalog health.
TACoS and contribution margin matter more than ACOS alone for beauty brands with repeat-purchase SKUs.
Buy Box percentage and IPI score predict revenue problems before sales data shows them.
Reporting cadence should shift with brand stage — weekly during launch, monthly once past $1M in annual sales.
A 2026 board report and a 2026 in-house ops report track different KPIs, not the same ones formatted differently.
Why this matters
Most beauty brands on Amazon inherit a reporting template from a spreadsheet someone built in year one and never revisit it. It tracks whatever was easy to pull, not what actually predicts revenue.
An in-house Amazon team like Booscala builds the KPI stack around the decision it needs to make next — reorder inventory, shift ad spend, or fix a listing — rather than around what the Seller Central dashboard happens to surface on the homepage. That distinction is the entire difference between a report that gets read and one that gets ignored by month three.
Beauty brands specifically carry two reporting blind spots general merchandise brands don't: shade/variant cannibalization across parent-child ASINs, and review velocity tied directly to conversion rate on new SKUs. A generic e-commerce KPI template misses both.
Amazon beauty brand reporting KPIs that matter
Here's the full stack, grouped by what each layer answers.
Revenue & growth
What it answers: Is the topline moving and where from
Best for: Founders tracking month-over-month trajectory
Profitability
What it answers: Is growth actually making money
Best for: Finance leads and boards
Advertising efficiency
What it answers: Is ad spend earning its keep
Best for: Whoever manages the PPC budget
Catalog health
What it answers: Will next month's revenue hold up
Best for: Ops teams and account managers
Each layer needs its own owner and its own cadence. Blending them into one 40-tab spreadsheet is how reporting dies.
Revenue and growth KPIs beauty brands should report
Total Sales and Units Ordered — the topline number everyone asks for first, but useless without a trend line, not a snapshot
Sessions and Page Views — traffic volume by ASIN, the leading indicator revenue lags by a few days
Conversion Rate (Unit Session Percentage) — the single number that separates a traffic problem from a listing problem
New-to-Brand percentage (if running Sponsored Brands or DSP) — tells you whether growth is coming from new customers or repeat buyers cannibalizing organic
Verdict: report these weekly during a launch window and monthly once the ASIN has 90+ days of stable data.
Profitability KPIs: contribution margin and TACoS
Revenue KPIs answer "is it growing." Profitability KPIs answer "should we be happy about that." Beauty brands with thin per-unit margins after FBA fees, glass packaging costs, and MAP-protected pricing need this layer more than most categories.
Contribution margin — revenue minus COGS, Amazon fees, and ad spend, calculated per ASIN
TACoS (Total Advertising Cost of Sale) — ad spend as a percentage of total revenue, not just ad-attributed revenue
Net margin after Amazon fees — the number that actually determines whether a hero SKU is worth defending with Lightning Deals or coupons
Contribution margin is the metric most beauty brands skip because it requires pulling COGS data that lives outside Seller Central. Skipping it is how a brand runs a "successful" Amazon business at breakeven for two years running. The contribution margin model built for Amazon beauty brands walks through the calculation ASIN by ASIN.
Advertising efficiency KPIs: ACOS, CTR, CPC
ACOS gets reported the most and understood the least. It only measures ad-attributed sales against ad spend on a single campaign — it says nothing about whether that campaign is growing the brand or just capturing sales that would have happened organically anyway.
ACOS (Advertising Cost of Sale) — per-campaign efficiency, useful for bid decisions
TACoS — the brand-level check on whether ad spend is actually driving incremental revenue
CTR and CPC by keyword — early-warning signals before ACOS moves
Impression share on branded terms — whether competitors are bidding on your own product name
The difference between the two matters enough that how TACoS differs from ACOS is worth a dedicated read before setting any 2026 ad budget targets. A brand chasing a low ACOS in isolation can end up with flat organic growth and rising TACoS — the report looks fine, the business isn't.
Pros of ACOS as a KPI: fast, campaign-level, good for daily bid tuning. Cons: blind to organic cannibalization, easy to game by narrowing targeting until spend (and reach) shrinks.
Catalog health KPIs: Buy Box, IPI, listing quality
This layer is the one boards never ask about and the one that predicts next month's revenue before the revenue KPIs do.
Buy Box percentage — lost Buy Box means lost sales regardless of how good the listing is
Inventory Performance Index (IPI) score — low IPI triggers storage limits that cap how much inventory you can even hold
Detail Page Quality / listing suppression status — a suppressed listing shows zero in every KPI above it
Return rate and negative review rate — leading indicators of a formula, shade-match, or packaging problem before it shows up in conversion rate
A brand can hit every revenue and profitability target for two straight months and still get blindsided by an IPI-triggered inventory cap in month three. Catalog health KPIs exist to catch that before it happens, not after.
Why the KPI mix varies by brand stage
The right report for a brand doing its first $500K on Amazon looks different from the report a $10M brand sends its board. Factors that should change the mix:
Revenue stage — pre-$1M brands need weekly conversion and inventory checks; post-$5M brands need monthly profitability and TACoS trends
Number of ASINs live — a 4-SKU catalog can report at the ASIN level; a 40-SKU catalog needs category rollups first
Audience for the report — a founder wants trajectory, a board wants margin, an ops manager wants inventory health
Ad spend as a percentage of revenue — heavy PPC dependence means TACoS deserves more weight than pure organic conversion rate
Marketplace footprint — a brand live in both the US and EU needs the KPI stack split by marketplace, not blended into one number
Automating the beauty brand reporting dashboard
Most brands hit a wall trying to pull contribution margin, TACoS, and IPI into one view because that data lives across Seller Central, Brand Analytics, and a separate COGS spreadsheet. Automating that pull is the same build-versus-buy decision founders run into everywhere else in the business — weighing the cost of AI automation against the hours a team spends stitching CSVs together manually every week.
The brands that get this right don't automate everything at once. They automate the layer that changes weekly — sessions, conversion, ad spend — and keep profitability and catalog health on a monthly manual review, because those numbers move slower and a dashboard glitch there is more costly to miss.
Related questions
What KPIs should go in a monthly Amazon report for a beauty brand?
A monthly report should carry Total Sales, Conversion Rate, TACoS, contribution margin, and Buy Box percentage at minimum. Anything more granular than that belongs in a weekly ops check, not a monthly summary — monthly reports that try to do both end up too long to act on.
How is TACoS different from ACOS for a beauty brand?
TACoS measures total ad spend against total revenue across the whole brand, while ACOS measures spend against ad-attributed sales on a single campaign. A brand can lower ACOS campaign by campaign while TACoS climbs, because narrowing targeting cuts organic halo along with wasted spend.
What's a good conversion rate for a beauty listing on Amazon in 2026?
Conversion rate benchmarks vary too much by sub-category — skincare, color cosmetics, haircare — to state one universal number for 2026. The more useful practice is tracking each ASIN's own conversion rate trend month over month rather than chasing a category-wide target that may not fit your price point or review count.
FAQ
What are the most important Amazon beauty brand reporting KPIs?
The four that matter most are Total Sales and Conversion Rate for growth, TACoS and contribution margin for profitability, ACOS and CTR for ad efficiency, and Buy Box percentage plus IPI score for catalog health. Miss the profitability or catalog health layers and revenue growth can mask a business that's losing money or about to lose inventory storage space.
How often should a beauty brand report Amazon KPIs?
Revenue, conversion, and ad spend KPIs should be checked weekly, especially during a product launch or Q4 push. Profitability and catalog health metrics like contribution margin and IPI move slower and hold up fine on a monthly cadence.
Is TACoS or ACOS more important for a beauty brand?
TACoS is more important for brand-level health because it accounts for organic sales alongside ad-attributed sales, while ACOS only measures per-campaign efficiency. Use ACOS for daily bid decisions and TACoS for the monthly question of whether ad spend is actually growing the business.
What is contribution margin and why does it matter for Amazon beauty brands?
Contribution margin is revenue minus COGS, Amazon fees, and ad spend, calculated per ASIN. It's the number that tells you whether a hero SKU is genuinely profitable once glass packaging, FBA fees, and PPC spend are subtracted, not just whether it's selling well.
Does IPI score actually affect Amazon reporting KPIs?
Yes — a low Inventory Performance Index score triggers storage capacity limits that can cap how much stock a brand can even hold, which shows up later as a revenue or stockout problem. Catalog health KPIs like IPI are leading indicators that predict revenue KPIs one to two months out.
What KPIs should go in a board-level Amazon report versus an internal ops report?
Board reports should lead with contribution margin, TACoS, and revenue trend, while internal ops reports need the granular weekly data: sessions, conversion rate by ASIN, and inventory health. Sending a board the same 40-tab spreadadsheet ops uses is the fastest way to get a report ignored.
How many KPIs should a beauty brand track on Amazon?
A working stack runs on roughly 8 to 10 core KPIs split across four layers — revenue, profitability, advertising, and catalog health. Tracking more than that without a clear owner for each number usually means most of them never get acted on.
One last thing
The KPI beauty brands most often skip isn't a fancy one — it's Buy Box percentage. A brand can be profitable, well-reviewed, and running efficient ads, and still lose 30% of a month's revenue silently because a third-party seller won the Buy Box on a listing nobody was watching. Check it before you check ACOS.
If reporting for your brand is still a monthly scramble across four disconnected tools, how to audit your Amazon beauty brand performance is the starting point before you rebuild the dashboard.
Get your KPI stack audited
See which reporting gaps are costing you revenue.
